
Brand performance refers to how a brand is perceived in the market, and how that perception translates into measurable business outcomes. It used to be a black box — impossible to measure or quantify. So the perception of brand teams suffered internally, as people thought they were only focused on “making things look pretty”. While marketing and analytics tools got increasingly sophisticated, and data-driven marketers became better at demonstrating the impact of their work, brand lagged behind.
But not any more. Modern brand tech stacks provide metrics, KPIs, and dashboards you can use to track brand performance — and improve it.

An introduction to brand performance metrics and KPIs
If you’re investing heavily in your brand, you want to be sure that investment’s paying off. A top-performing brand has strong recognition in the market, achieved through high levels of consistency across visuals, messaging, and culture.
But there’s still a lingering perception of “brand” as a soft, intangible project — a nice-to-have that doesn’t really drive any actual business value. Marketers and brand leaders can overcome that assumption by tracking core metrics and KPIs that demonstrate the tangible benefits of their brand.
When measuring brand performance, your KPIs fall into two categories, measuring internal and external performance.
Internal brand performance metrics
Metrics for measuring internal brand performance help you understand the levels of brand adoption and engagement across your internal team. These drive brand consistency across all channels and touchpoints, which is essential for building brand recognition externally.
External brand performance metrics
Metrics for measuring external brand performance help you understand how your brand is perceived within the market, and how it stacks up against your competitors.
A balanced view of brand performance connects how well your brand is used inside the company with how well it’s recognized outside it.
The role of brand KPIs
Key performance indicators (KPIs) are measurable and quantifiable metrics that track your progress toward a specific goal or objective. They connect high level goals (like brand awareness or adoption) to measurable business outcomes. This helps you demonstrate tangible brand growth and tie it back to the benefits and value for the organization.
Before setting goals or measuring growth, take baseline performance measurements of your key metrics. These will help you track growth over time, to demonstrate the growing value of your brand.
There are several mistakes companies often make when tracking brand performance KPIs:
- Tracking too many metrics: Too many metrics can bring data overwhelm, where it’s impossible to spot trends and gain important insights. Additionally, if you try to track lots of brand KPIs you’ll spend all your time gathering and analyzing data, rather than having time to invest in improving brand performance.
- No reliable way to measure: Sometimes companies want to track things that are too difficult to measure. For more abstract concepts like awareness or adoption, look for things you can actually measure, such as branded search or asset use.
- Not connecting to the big picture: Each KPI should ladder up to either brand perception (for external performance indicators) or brand engagement or enablement (for internal metrics). If not, they don’t tell you much useful about your brand performance.
Tools, channels and systems for measuring brand performance
There are various tools and channels that make tracking brand performance easier. Getting proper visibility across all your systems provides tangible data for tracking and measuring brand metrics.
Brand guidelines analytics
Tracking guideline analytics data helps you understand brand adoption internally. Different departments and team members will be using your assets, and you want to be confident that all employees use the correct elements to present a consistent brand identity outside the company.
If you use online brand guidelines like Frontify, you can access data that provides insights into brand guideline usage. For example, you can track how many people visit the guidelines on logo usage and whether they download a file from that page. Then, you can use this data to improve how people interact with your brand guidelines.
Here are some of the metrics you can track in your brand guidelines analytics:
Guideline views
Measure how many times your brand guidelines are viewed each month and how that changes over time. Low usage suggests low levels of brand engagement. If the number of views drop, run focused training and education sessions to help people understand how to use your brand guidelines.
Spikes in visits
While tracking visits to your brand guidelines, look out for sudden increases as well as drops. If you see spikes in visits to specific sections or assets, you’ll know those are the most valuable brand materials for your internal stakeholders. Therefore, if you update anything on those pages, you can prioritize an internal education campaign to help people understand how the brand is evolving.
Search terms
Monitor what people are searching your brand guidelines for. Look at the top search terms to identify your most-used brand elements, but also look at searches that return zero results. These help you spot gaps in your brand guidelines, or areas where team members need more support or guidance from your brand team.
Unique active users
Tracking active users helps you assess levels of brand engagement across the business. For example, you may have lots of views but they’re all coming from one department. Ideally you want active users from every team in the business, as this indicates high levels of brand engagement company-wide, rather than just within your marketing or brand team.
Guideline deviations
Finally, you can track any inconsistencies in your brand. If you notice patterns where specific teams or team members struggle to follow your brand guidelines, you can check their guideline usage. Run a permissions audit to ensure everyone has access to your brand guidelines, at a level that’s appropriate for their role.
Digital asset management (DAM)
A DAM solution provides companies with a centralized location to organize and share all their brand assets. Teams can collaborate and create new assets or use existing files from other departments.
Additionally, a DAM provides analytics data that can help you improve brand performance. Frontify’s DAM analytics reveal which assets drive the most reuse and where creative bottlenecks appear. You can view historical data on how often assets get used and by whom. This information gives brand managers a complete understanding of asset usage across the organization.
Here are some of the metrics you can track with your DAM platform’s analytics, to help you measure your internal brand performance.
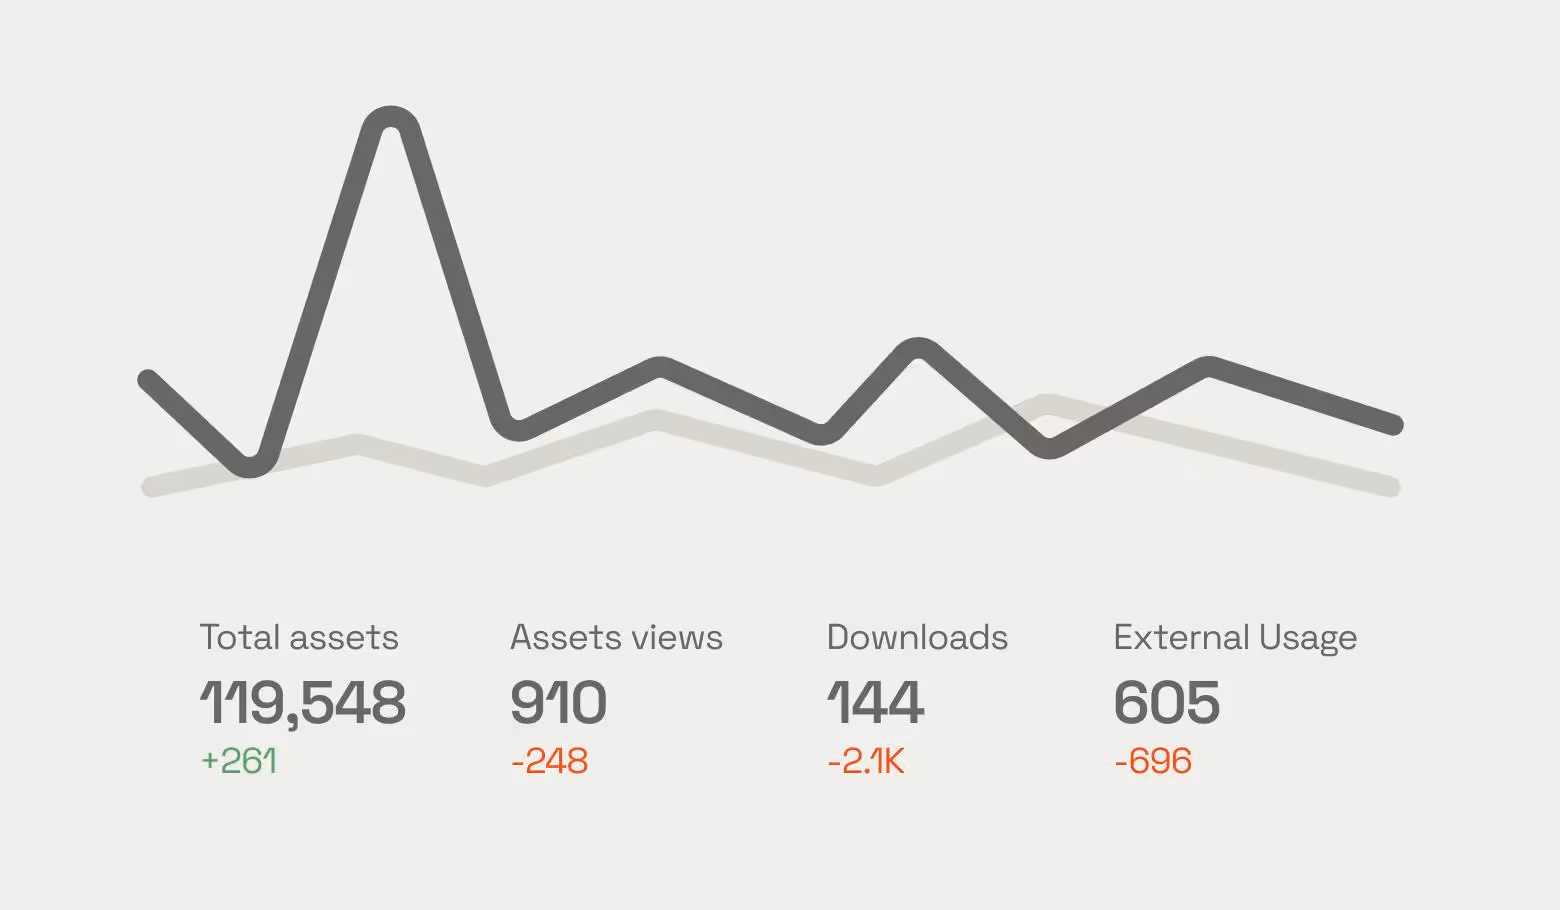
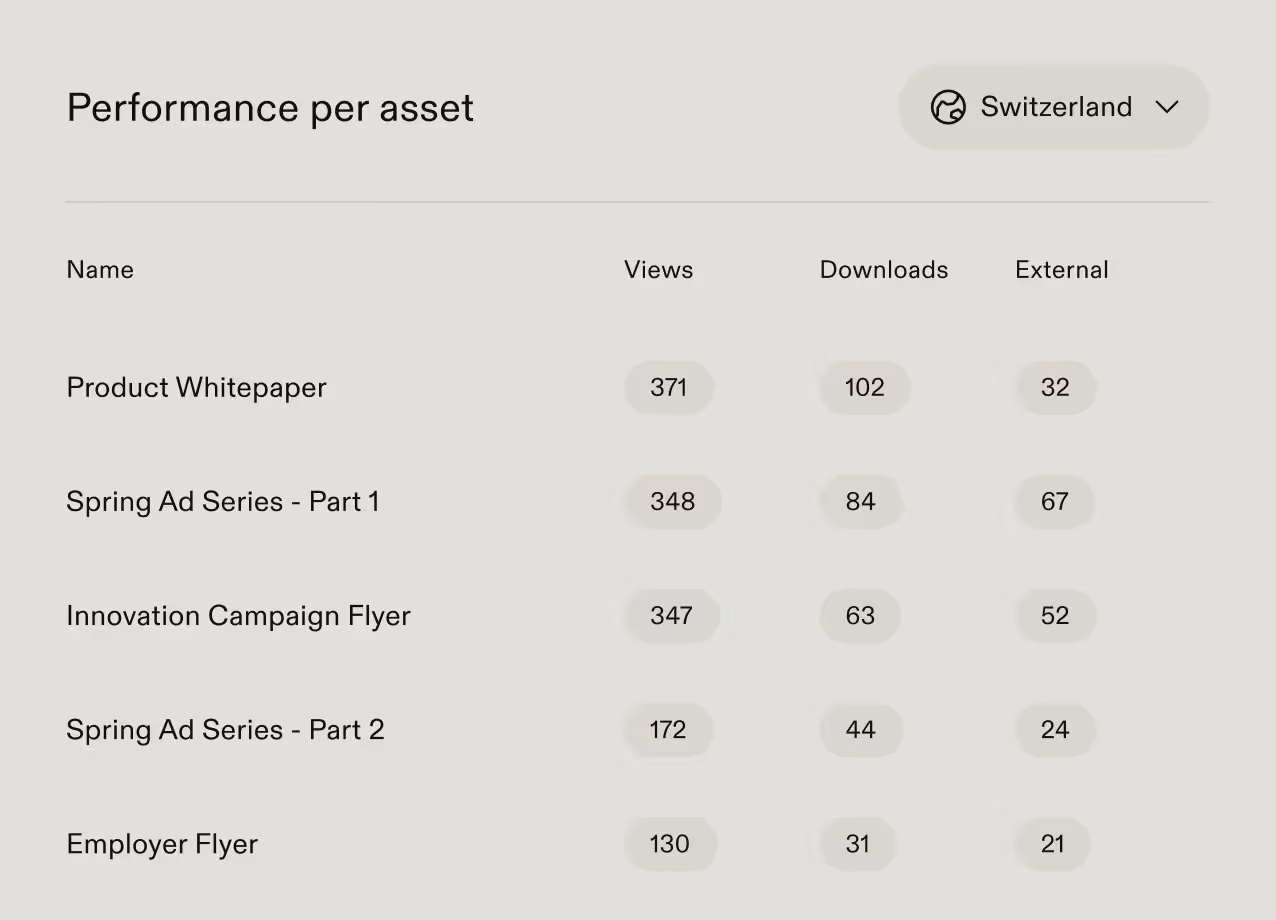
Asset views and downloads
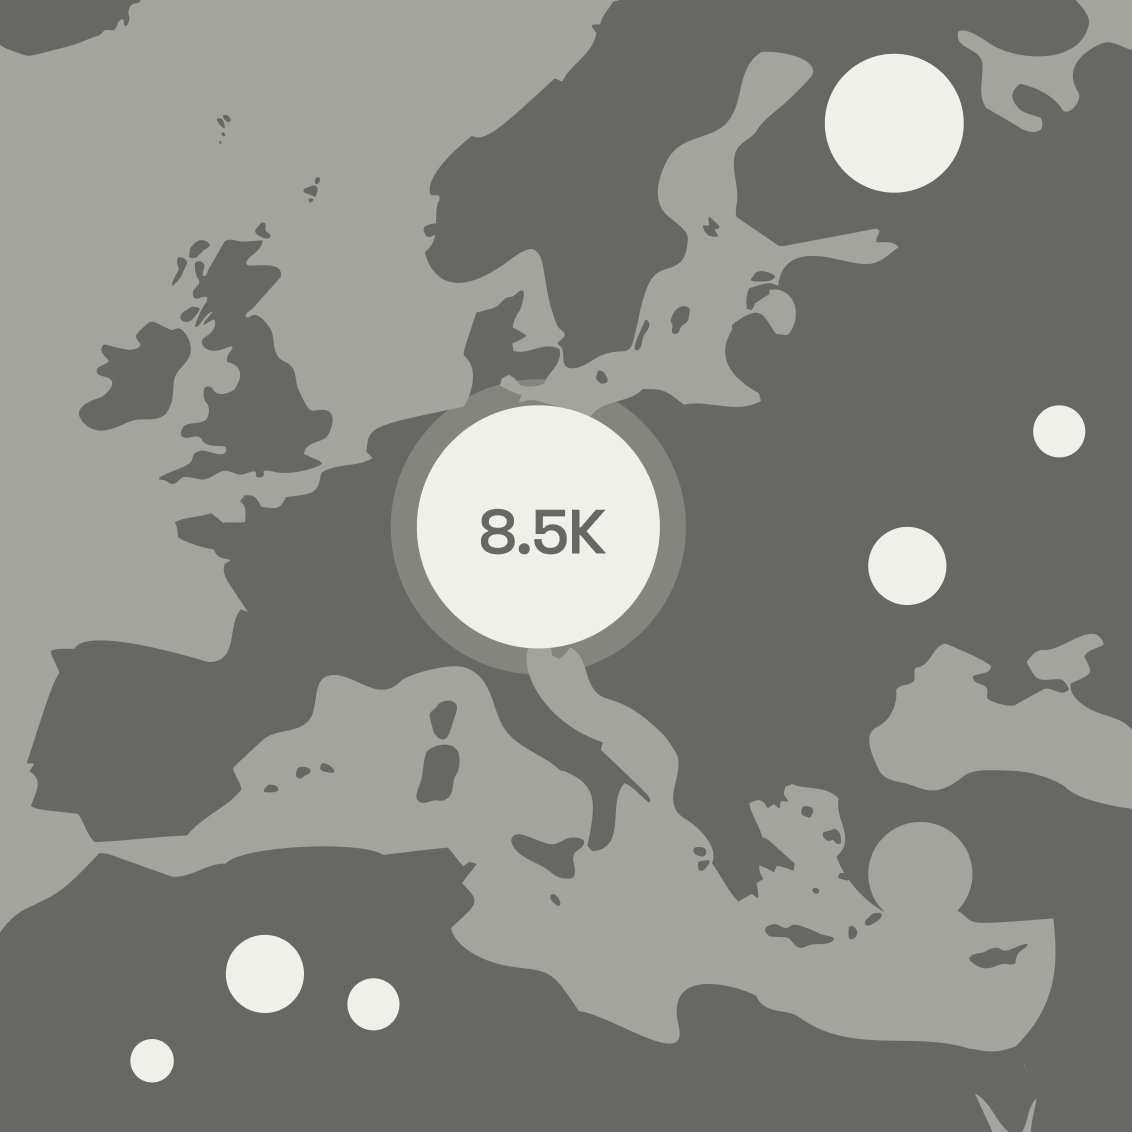
Track how many views and downloads your brand assets have each month. Low numbers of views and downloads — particularly of core brand assets like logos or campaign materials — suggests low levels of brand adoption and can indicate inconsistencies across the business. Some DAM platforms like Frontify let you filter this data by location, so if you have a global team you can see how each region or office is using your brand assets.
External asset usage
See how often brand assets are being used externally — for example if they’re being viewed by external partners like agencies or freelancers. Look out for spikes or drops in usage as they will be worth investigating to find out what’s caused the sudden change from normal usage levels.
DAM searches
Monitor what people are searching your DAM platform for. Look at the top search results to identify your most-used brand assets, but also look at searches that return zero results. These help you identify assets or templates that are missing and your team would use if they were available.
Cross-channel measurement
While tools like digital asset management and brand guidelines give you the data to measure your internal brand performance, you also need to understand the performance and perception of your brand outside the business.
External brand performance is typically tracked using tools such as Google Analytics or social media monitoring apps. You can also run surveys to collect data around brand awareness and brand loyalty, so you can track how that changes over time.
How to turn brand analytics into operational insights
By tracking brand analytics across different tools and platforms, you can collect lots of data related to your brand’s performance, both internally and externally. But collecting analytics data is just the starting point — you need to interpret it to gain operational insights, and act on them to drive improvements in your brand’s performance.
This five-step framework will help you turn analytics data into actionable insights for your organization:
- Collect: Collect data from your brand guidelines, DAM, and other channels like GA4 or social listening tools
- Interpret: Interpret your analytics data looking for changes over time, spikes or large drops in usage, and outliers or unusual use cases
- Optimize: Make changes to your assets, training, or internal processes based on insights from your analytics data
- Repeat: Track brand performance KPIs on a monthly basis, using a dashboard to monitor changes over time.
For example, using this framework to track brand performance can give you insight on:
- Asset use and adoption, so you can balance content creation and distribution
- Guideline visits and brand consistency, so you can provide training and support as needed
- Content gaps based on low asset use or empty search results, so you can create or update missing assets
- High-performing or most valuable assets, so you can amplify them by adding them to guidelines or brand portal home pages to boost adoption even further.
Measuring your brand performance shouldn’t be treated as a simple tick-box activity. Over time it provides the insights and feedback loop that keeps your brand relevant and evolving to keep up with changing market conditions and customer expectations.
How brand performance data drives budget & decision-making
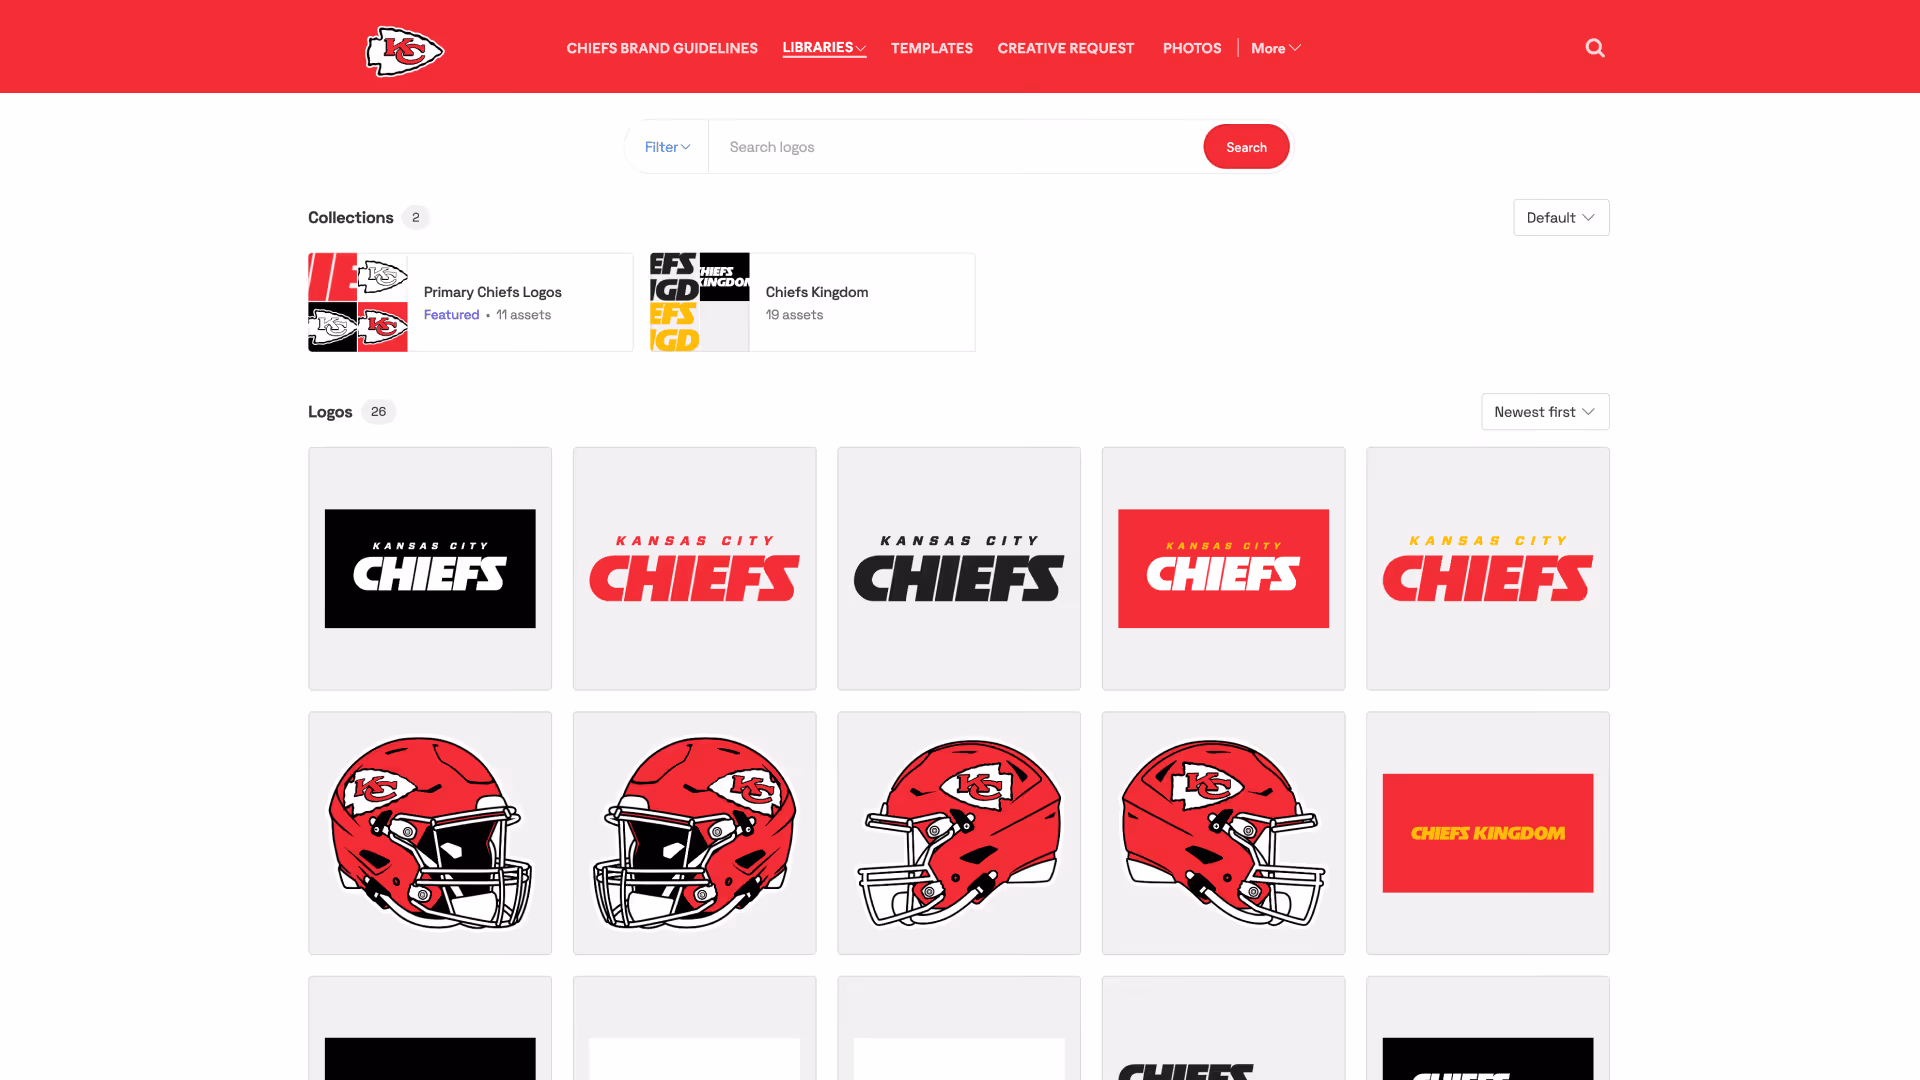
Tracking brand performance can guide your decision-making when it comes to optimizing brand-related spend, so you’re investing in areas that need it most. Jordan Giesler, Creative Director at Kansas City Chiefs explains, “In brand management, data is your roadmap to consistency and impact.”
For example, you can understand how global teams use brand assets and determine if you need to invest more in training materials or other resources in certain regions. Giesler adds, “With Frontify Analytics, you get a clear picture of how assets, guidelines, and templates are being used — helping you make smarter decisions.”
You can also demonstrate the tangible business benefits that your brand tools and systems provide:
- Faster time-to-publish for brand materials, requiring fewer resources and improving time to market
- Reduced rework of off-brand assets, saving internal resources and creative budget
- Improved brand adoption and employee self-serve when using and creating brand assets, requiring less involvement from your brand or creative teams
- Time savings for brand and creative teams, spending less time on low-value administrative work so they can refocus on higher value strategic projects.
When you can measure brand adoption and consistency, you can prove return on investment, making it easier to secure budget for future investments in brand-related tools or projects. Tracking performance metrics helps quantify your brand value and brings concrete data and measurable benefits into budget conversations to help make the case for further investment.
Integrated tools aid brand performance with seamless brand operations
To improve the performance of your brand externally, you need to get it working well internally first. It’s impossible to build a market-leading, strong brand with a consistent, recognizable identity if your internal teams aren’t aligned around your brand.
To achieve these goals, you need to help people use the brand in their daily work:
- Sales teams share brand messaging that consistently reflects your core values
- Marketing teams accurately represent the brand, even in their most creative marketing campaigns
- Back-office teams like finance and IT know how to correctly use your logos, typography, and colors to present a professional brand image.
The right tools make it easy to improve internal brand performance. A brand platform like Frontify provides a centralized home where all users can connect with the brand. It hosts your brand guidelines, DAM, templates and other resources that help improve collaboration and adoption.
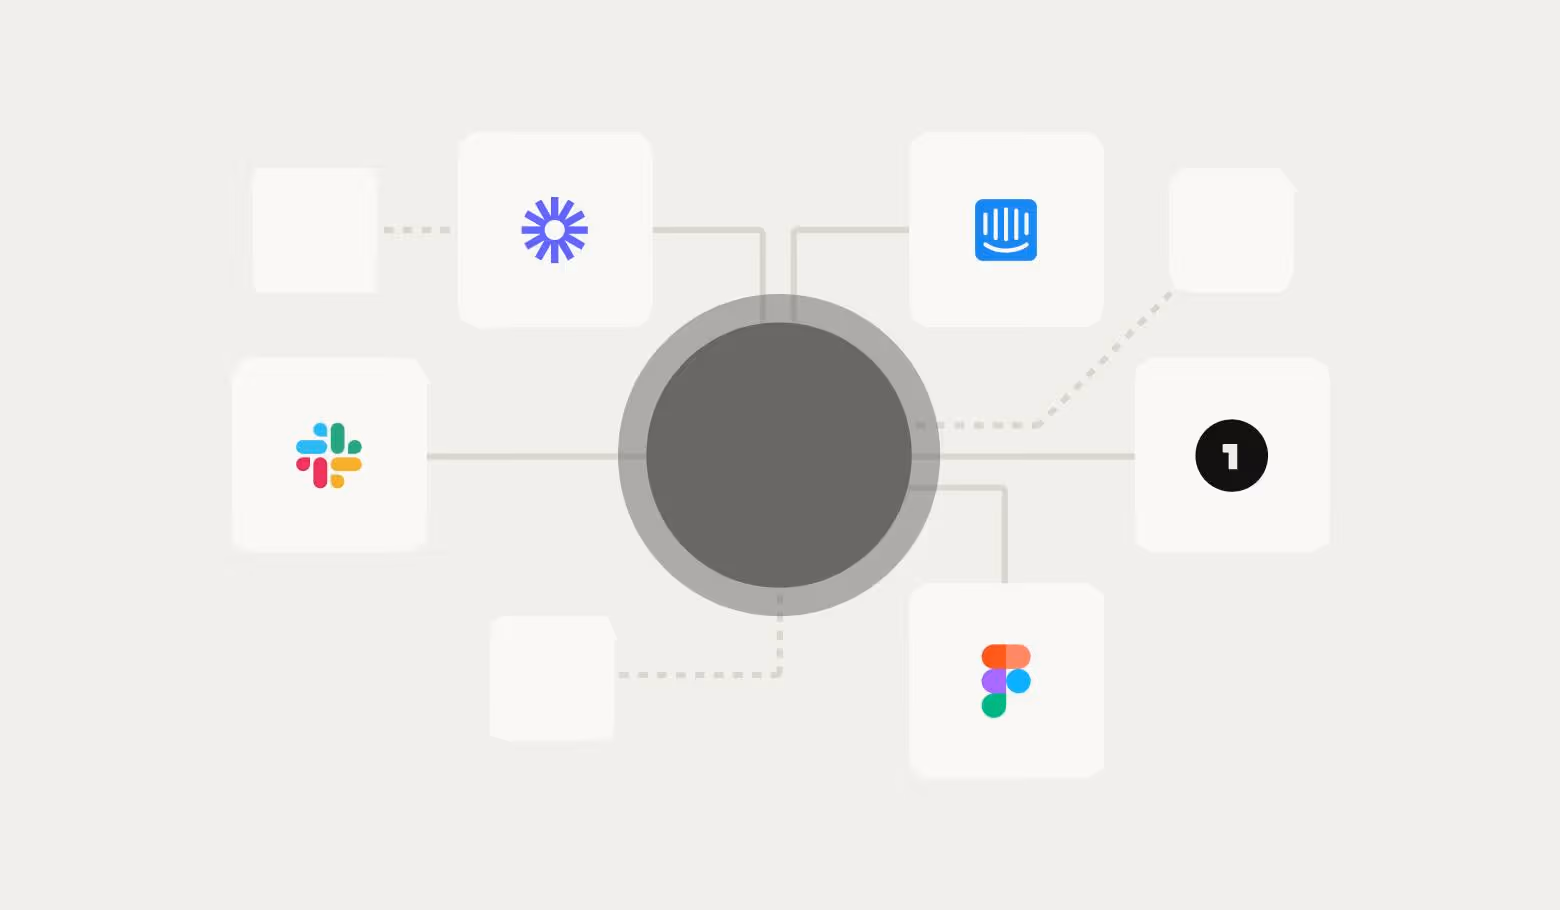
Once you’ve connected all your brand management tools — like guidelines and DAM — you should look at connecting your brand platform with the other core tools in your tech stack. For example, connecting with Figma, Adobe, or Canva will enable designers to seamlessly find relevant, on-brand assets for their projects. Marketing tools like your CMS or content creation applications connect with your brand management platform so the team can find brand files quickly and easily.
By integrating your brand platform with other tools your team uses every day, you can drive growth and brand adoption across the business.
Frontify supports your brand from performance to enablement
Measuring key brand metrics is the start of your brand performance journey. Tracking data helps you understand patterns and predict upcoming trends, giving you the insights to support long-term brand adoption and engagement. If you understand brand adoption within your business, you can make operational and process changes to drive enablement and empowerment, making your brand a whole-company priority rather than just a task for your marketing team.
Frontify’s brand platform and analytics provide adoption and usage metrics that you can use to drive real organizational change. Learn how to measure brand engagement with Frontify.