The Unfiltered Truth About Brand Performance with Analytics
Building a consistent brand is important. And in order to do that you need the ability to measure performance and improve brand-lifting decisions. Let's talk about how that's possible with the new Frontify Analytics.
Every brand strives to have its unique positioning that no other competitor can steal. And when you are in the nitty-gritty of perfecting your brand’s experience, analytics is something easy to put off. But as your brand grows, things get complicated. Your brand assets and audience are increasing at an exponential rate. And so are the decisions you have to make.
It’s easy to sink massive engineering resources into creating customizable dashboards. But these could be hard for you and your team to access and use. And frankly, every time data is hard to access or understand, people are making slower decisions.
The perfect place to start is with a brand management platform that helps you capture your brand interactions – giving you the clarity you need to make better decisions.
Meet the New Analytics Dashboard: A Global Vision of Your Brand from the Sum of its Parts
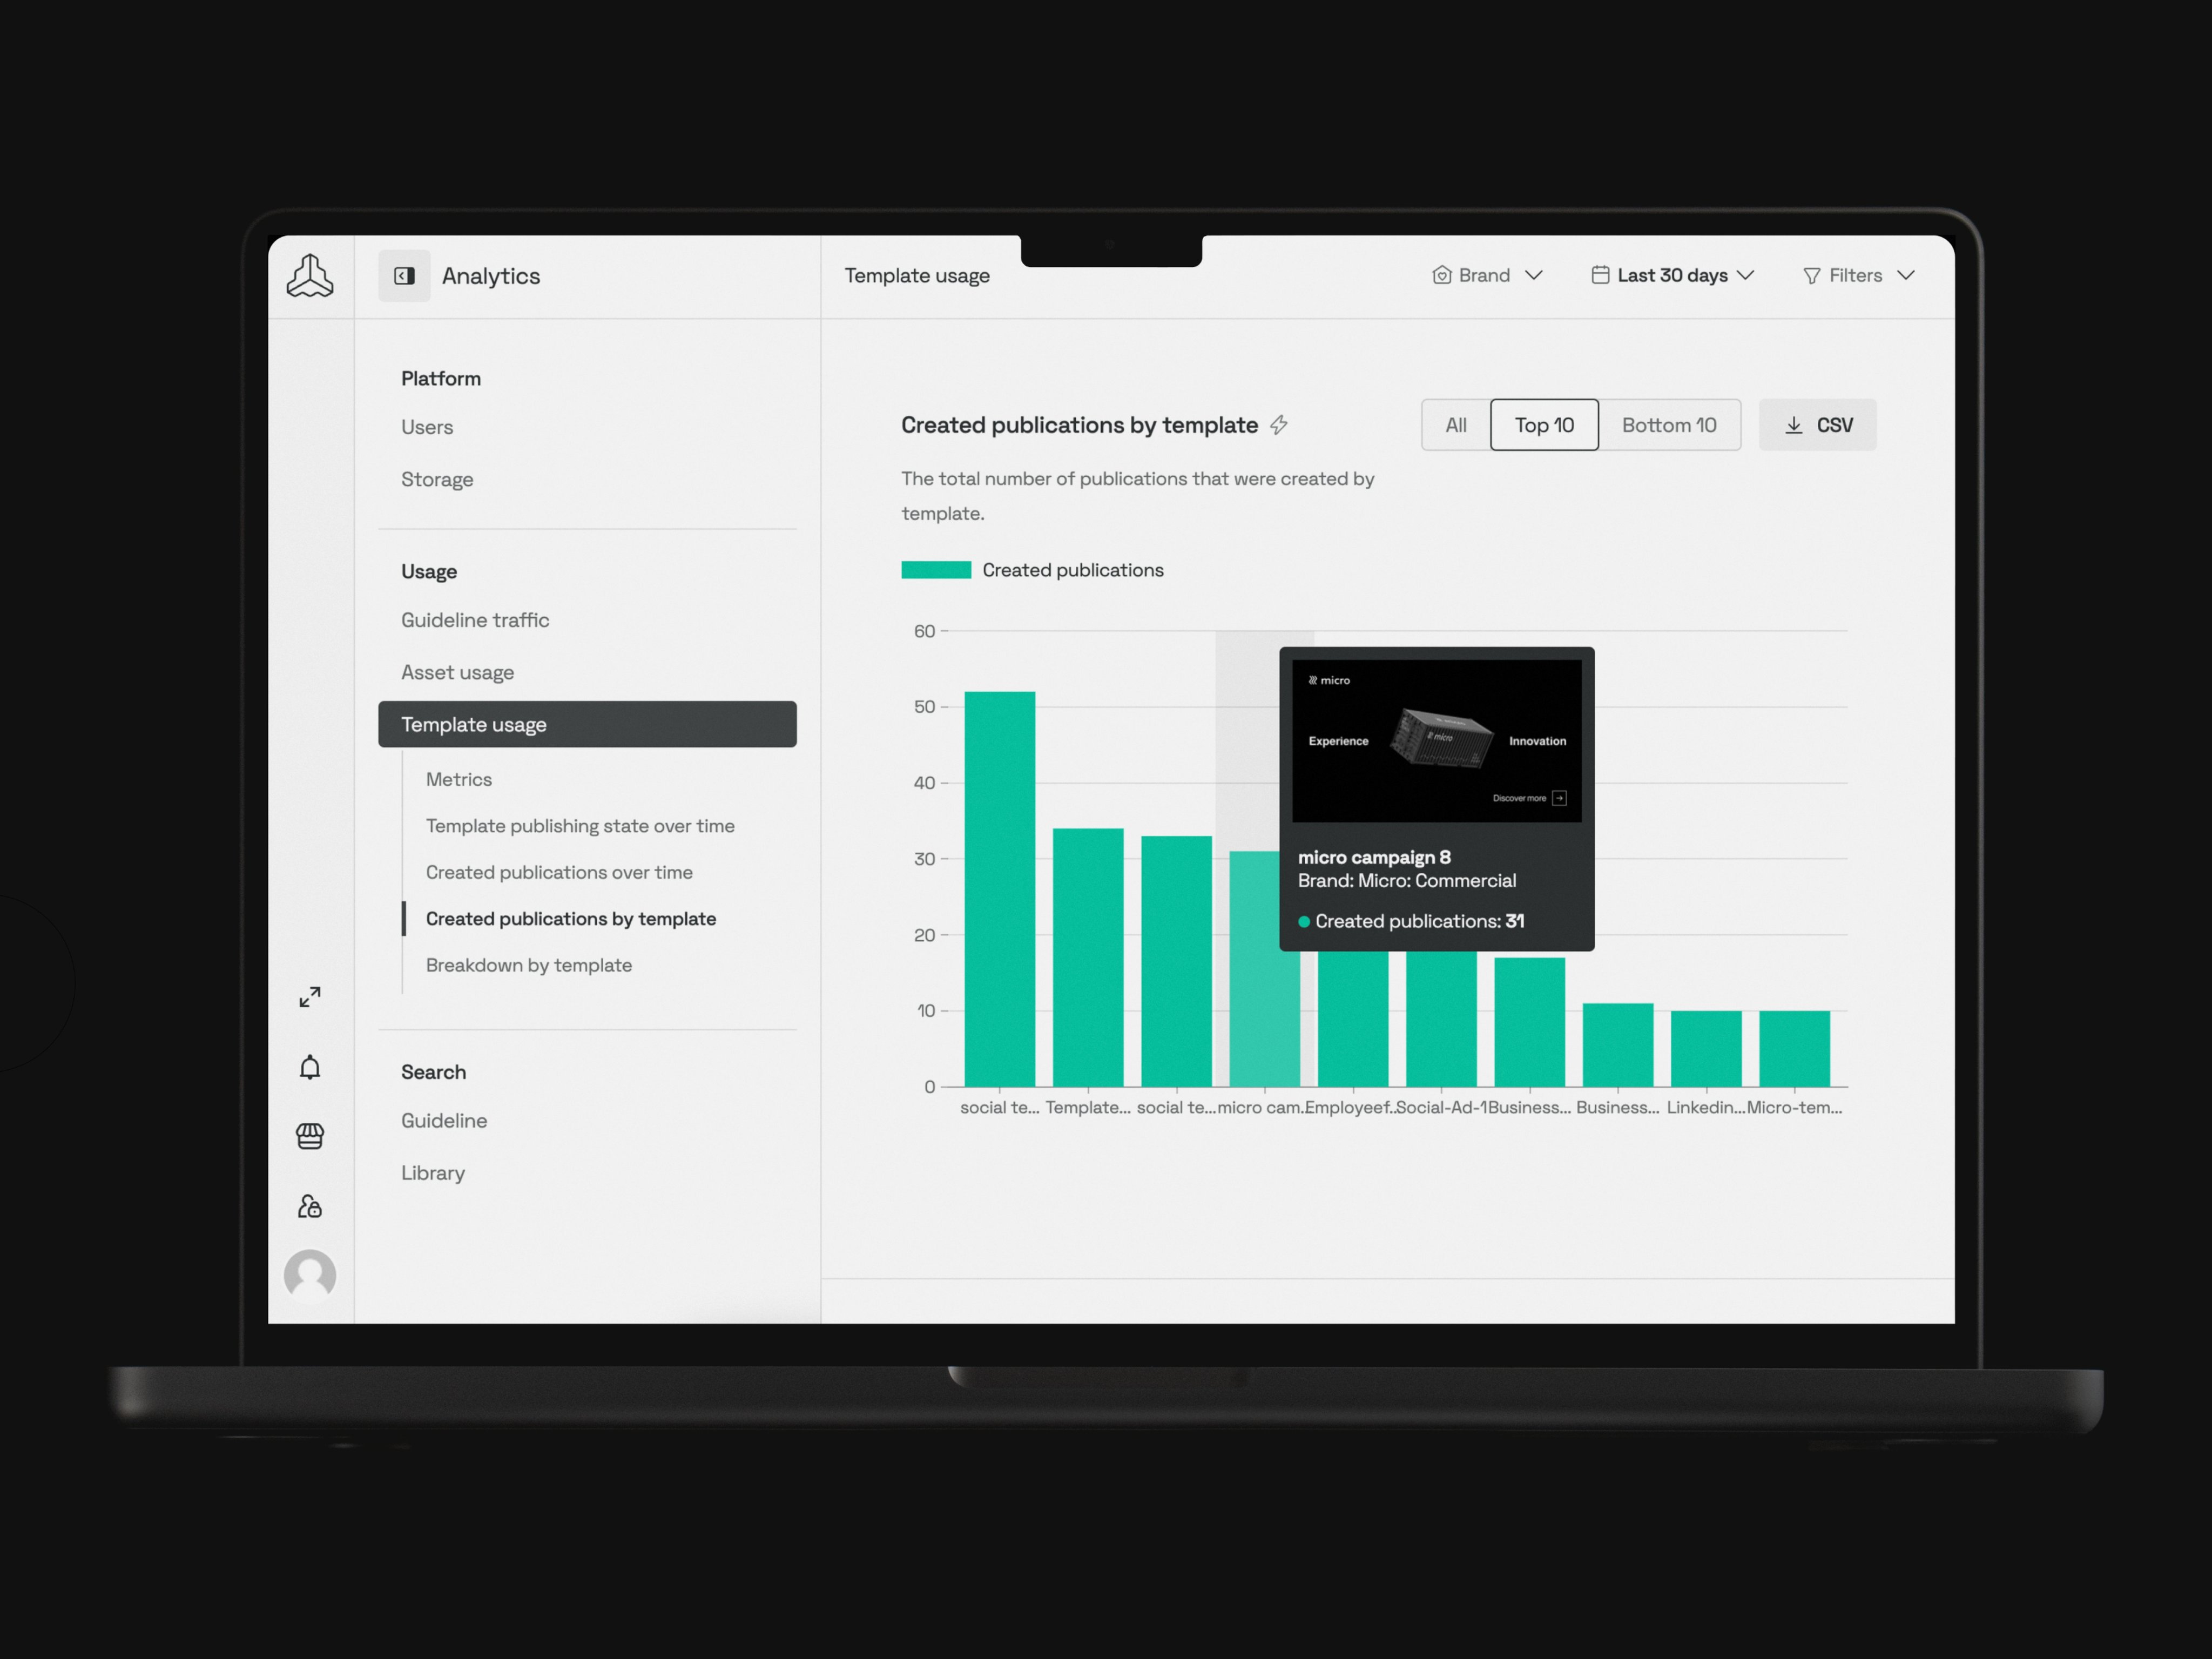
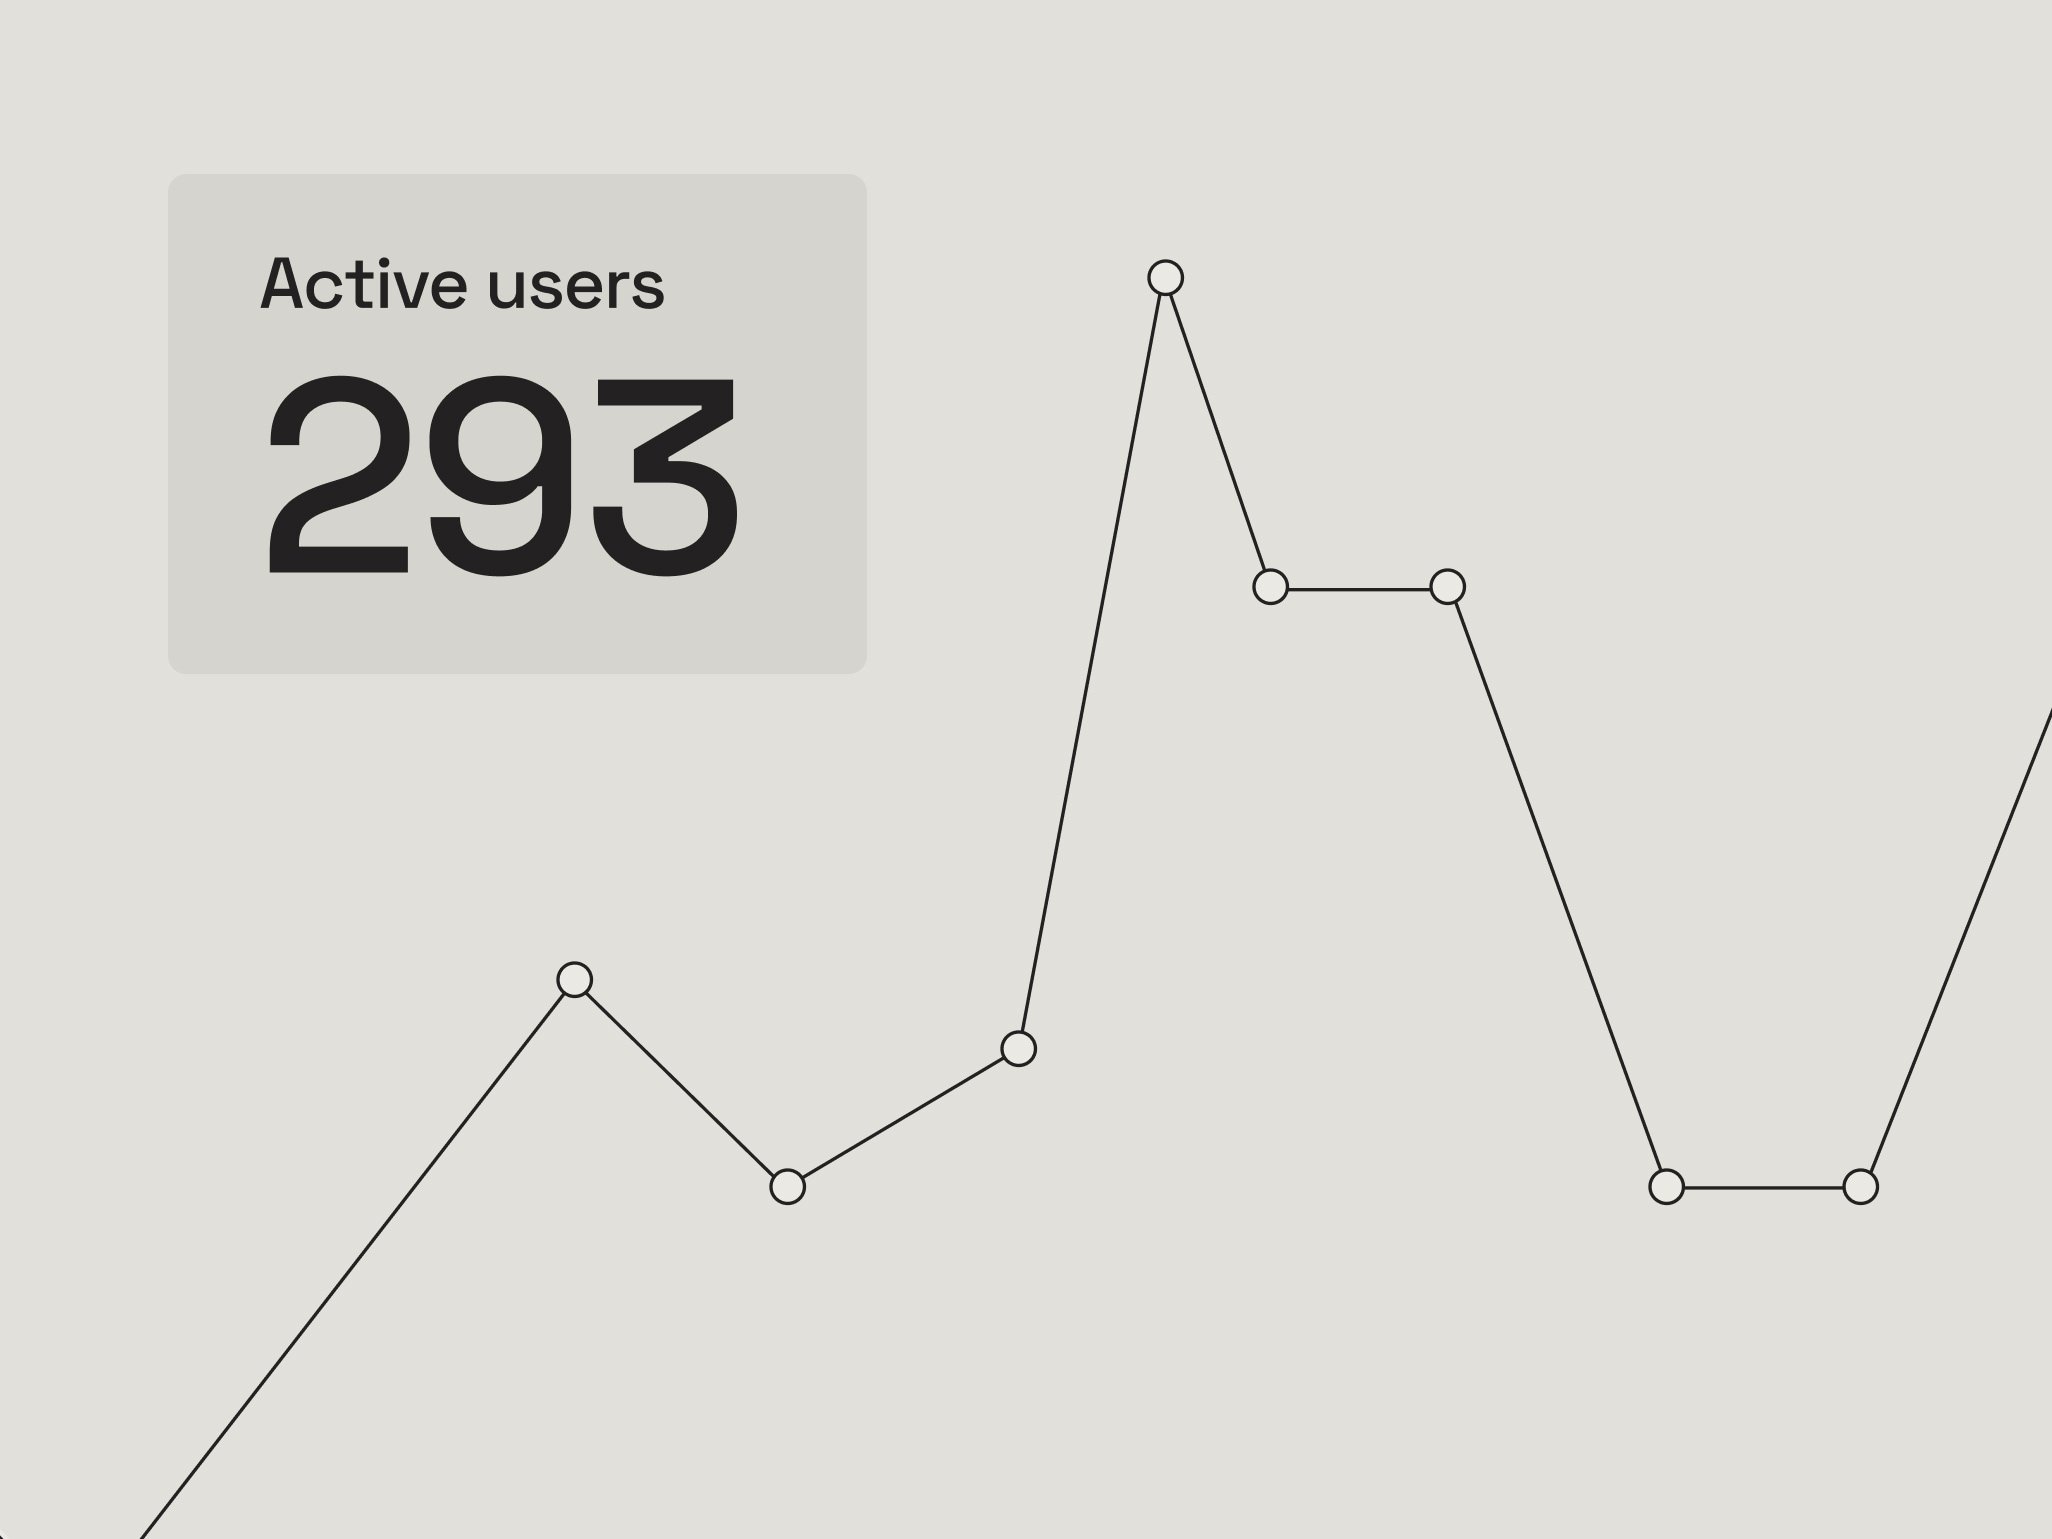
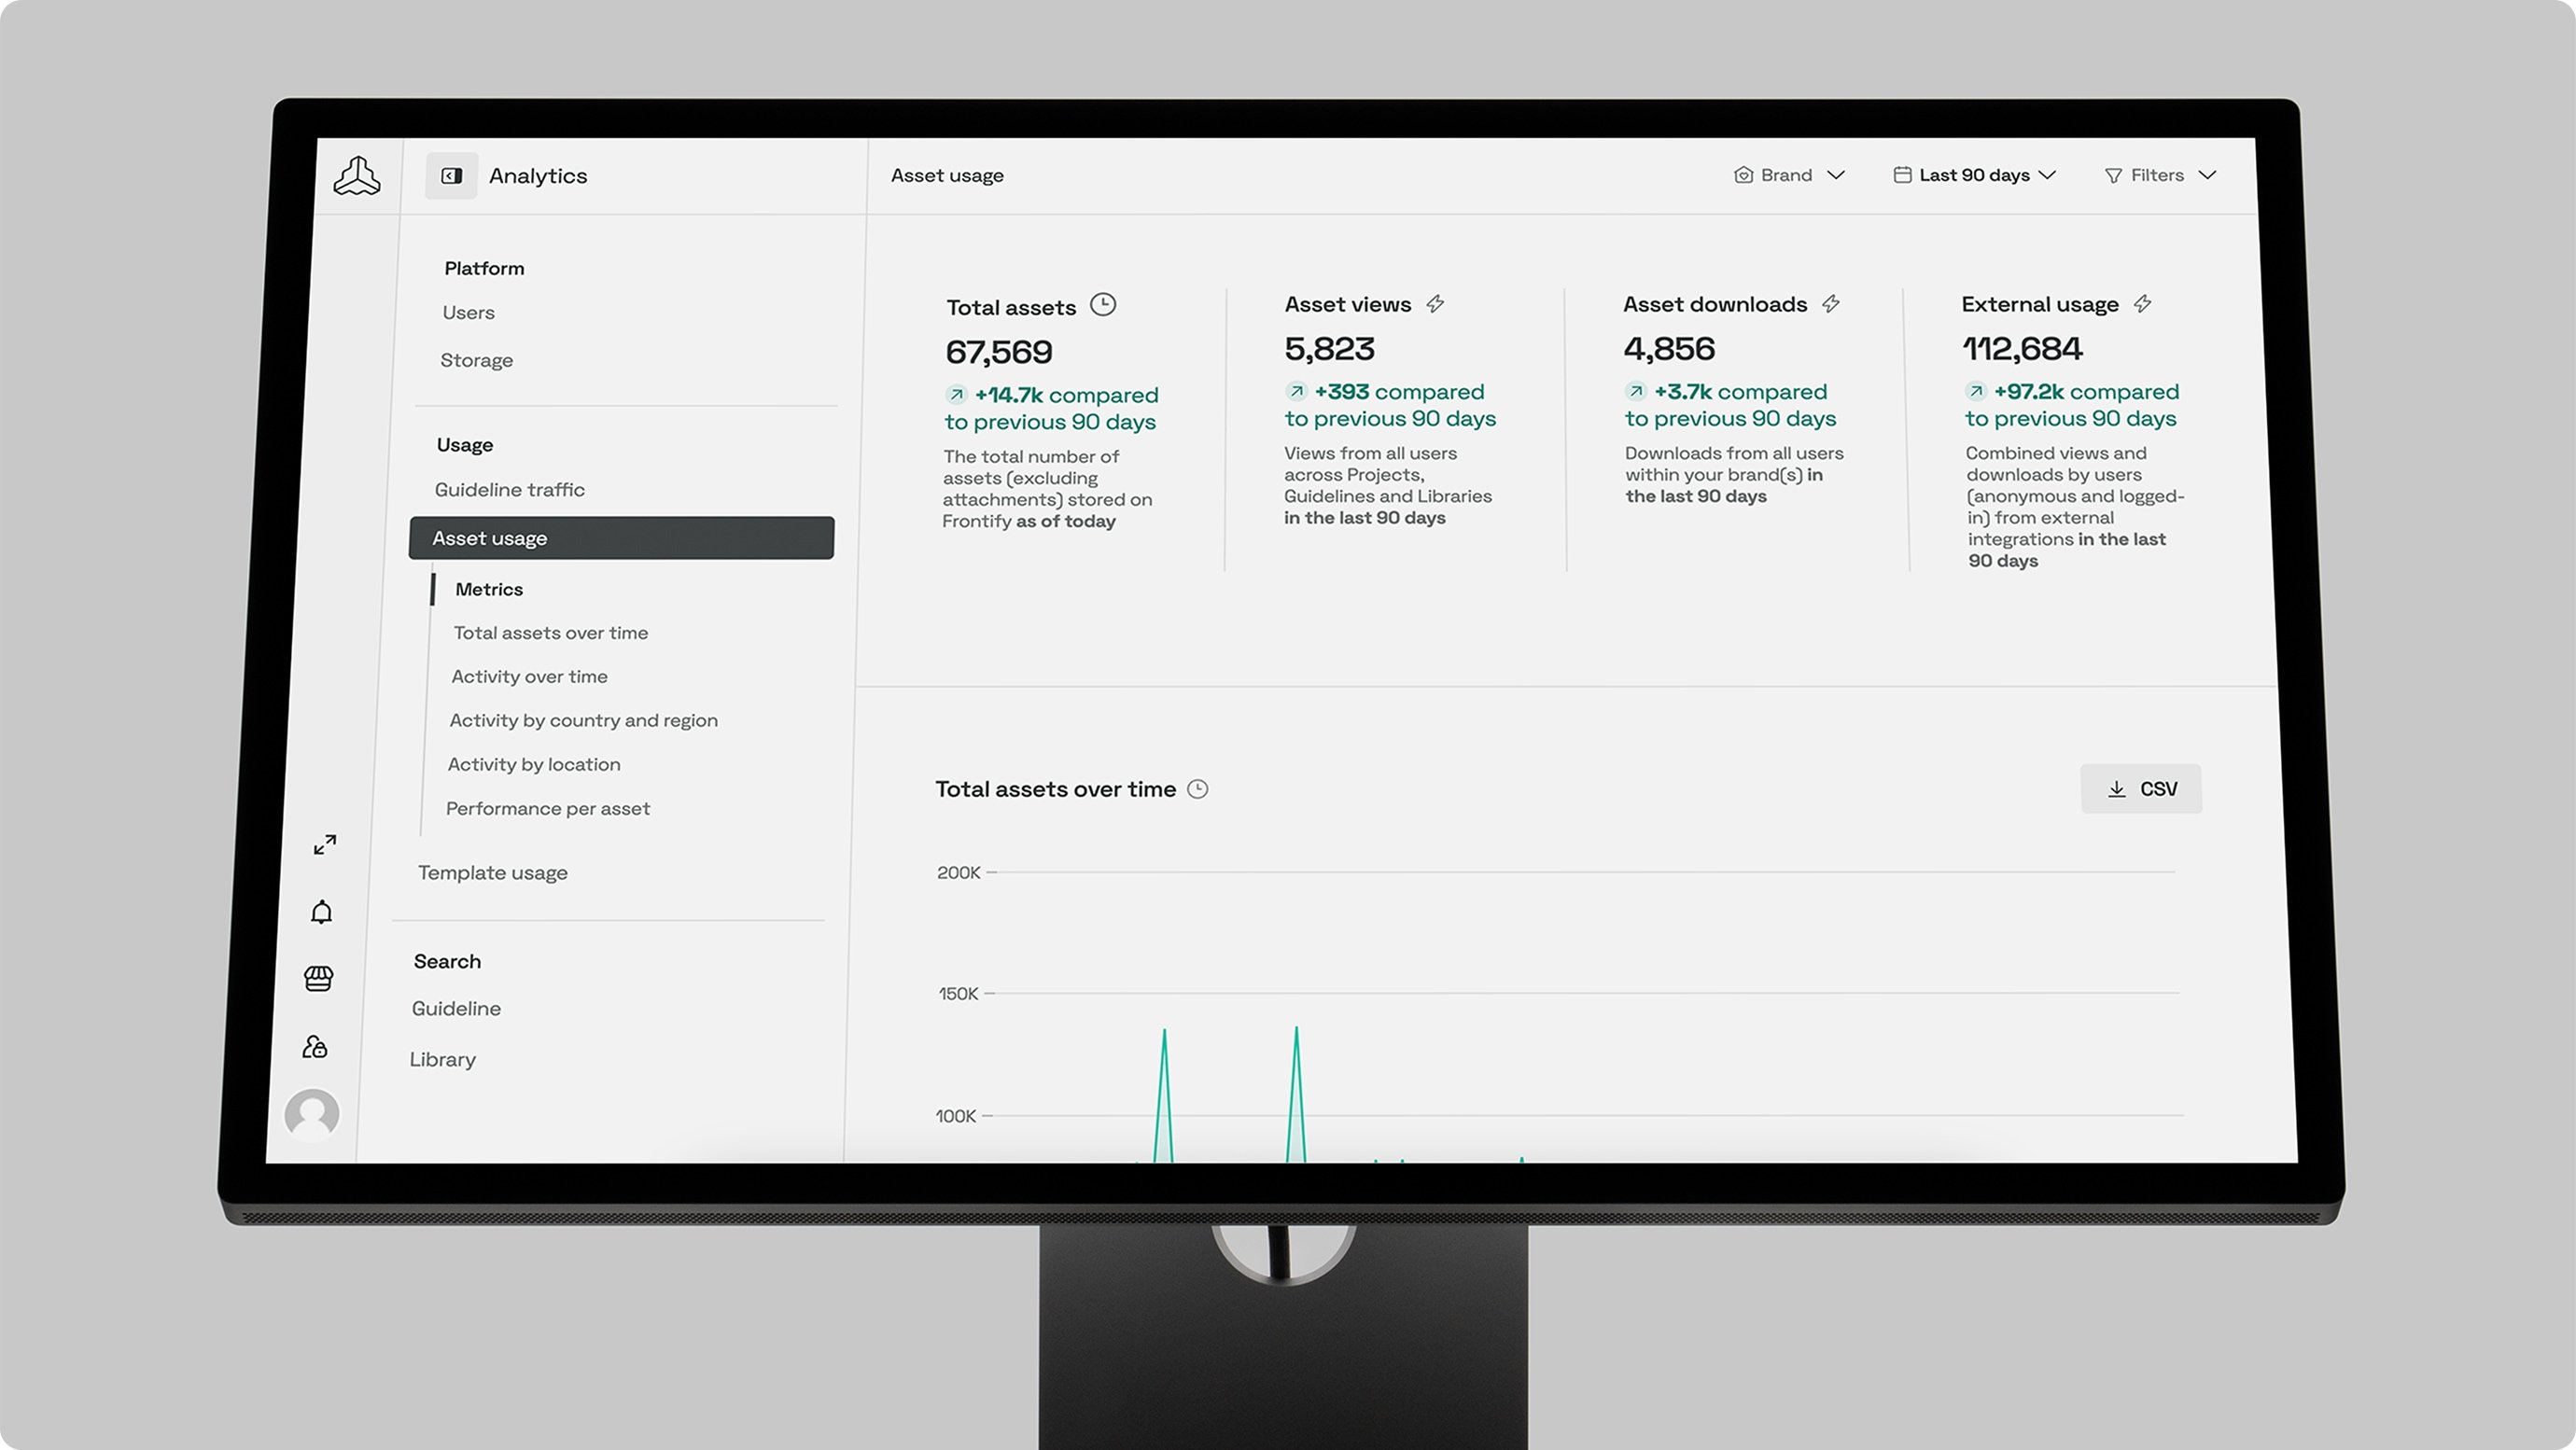
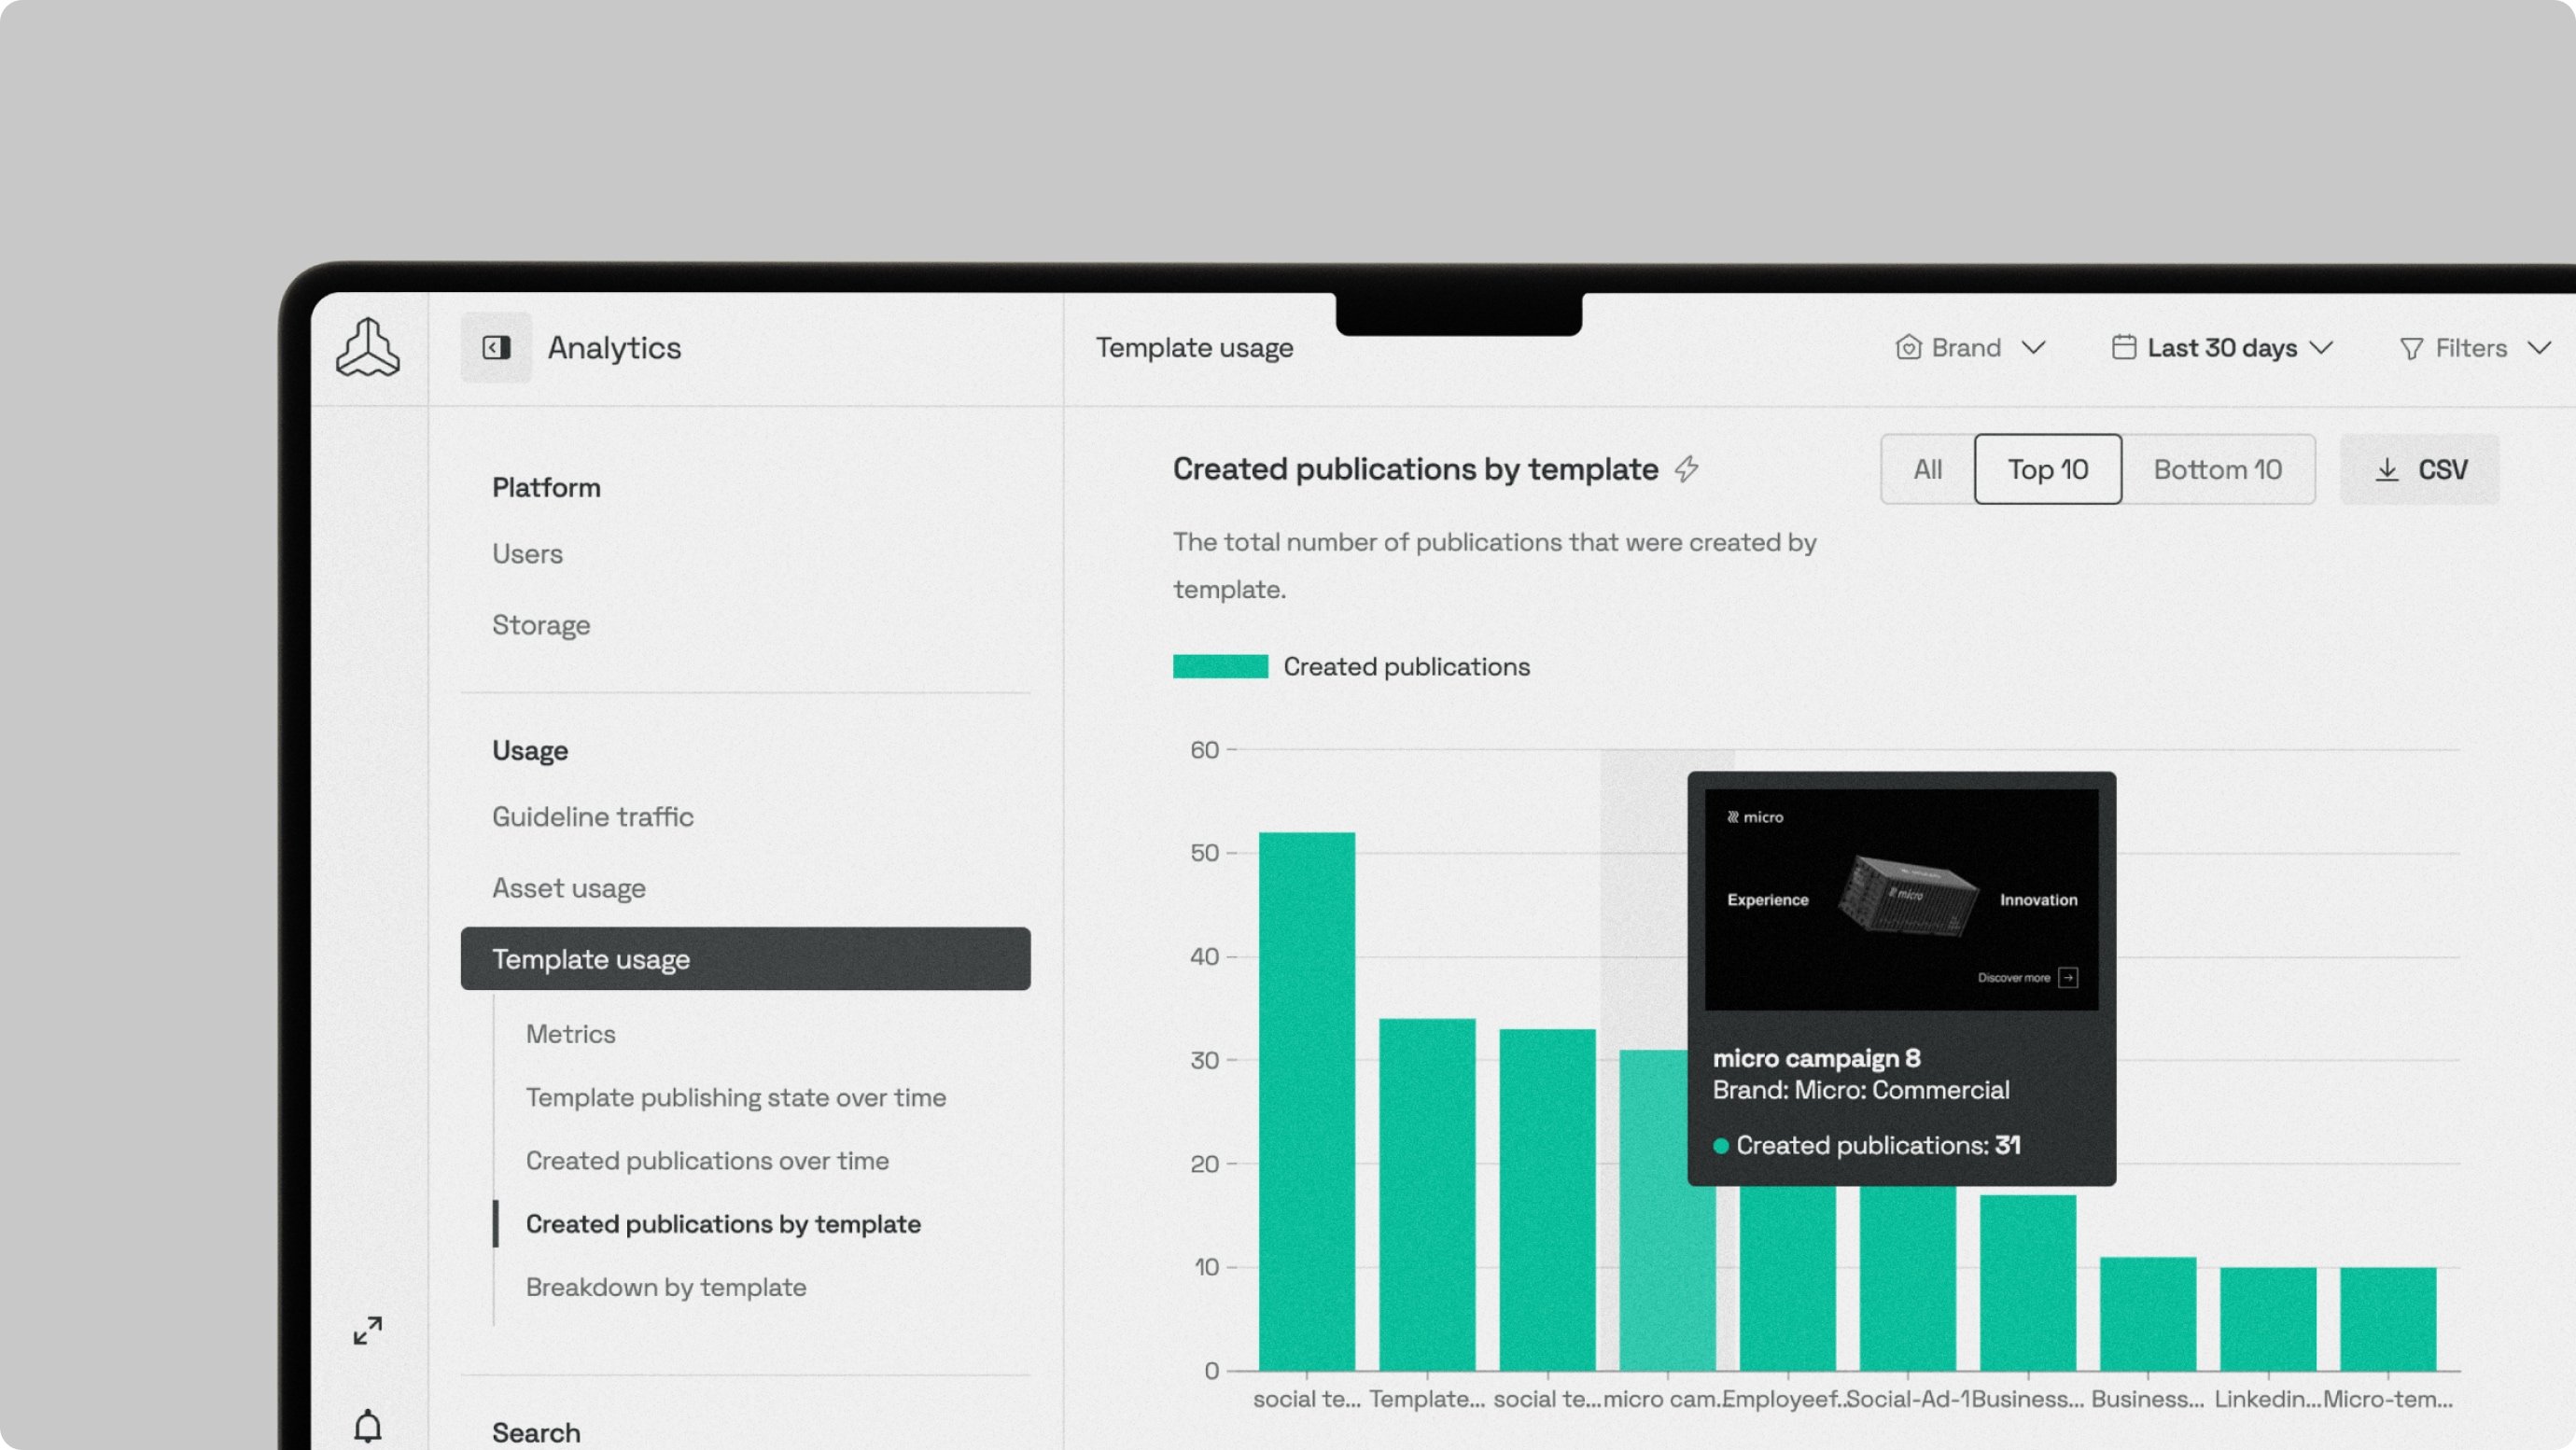
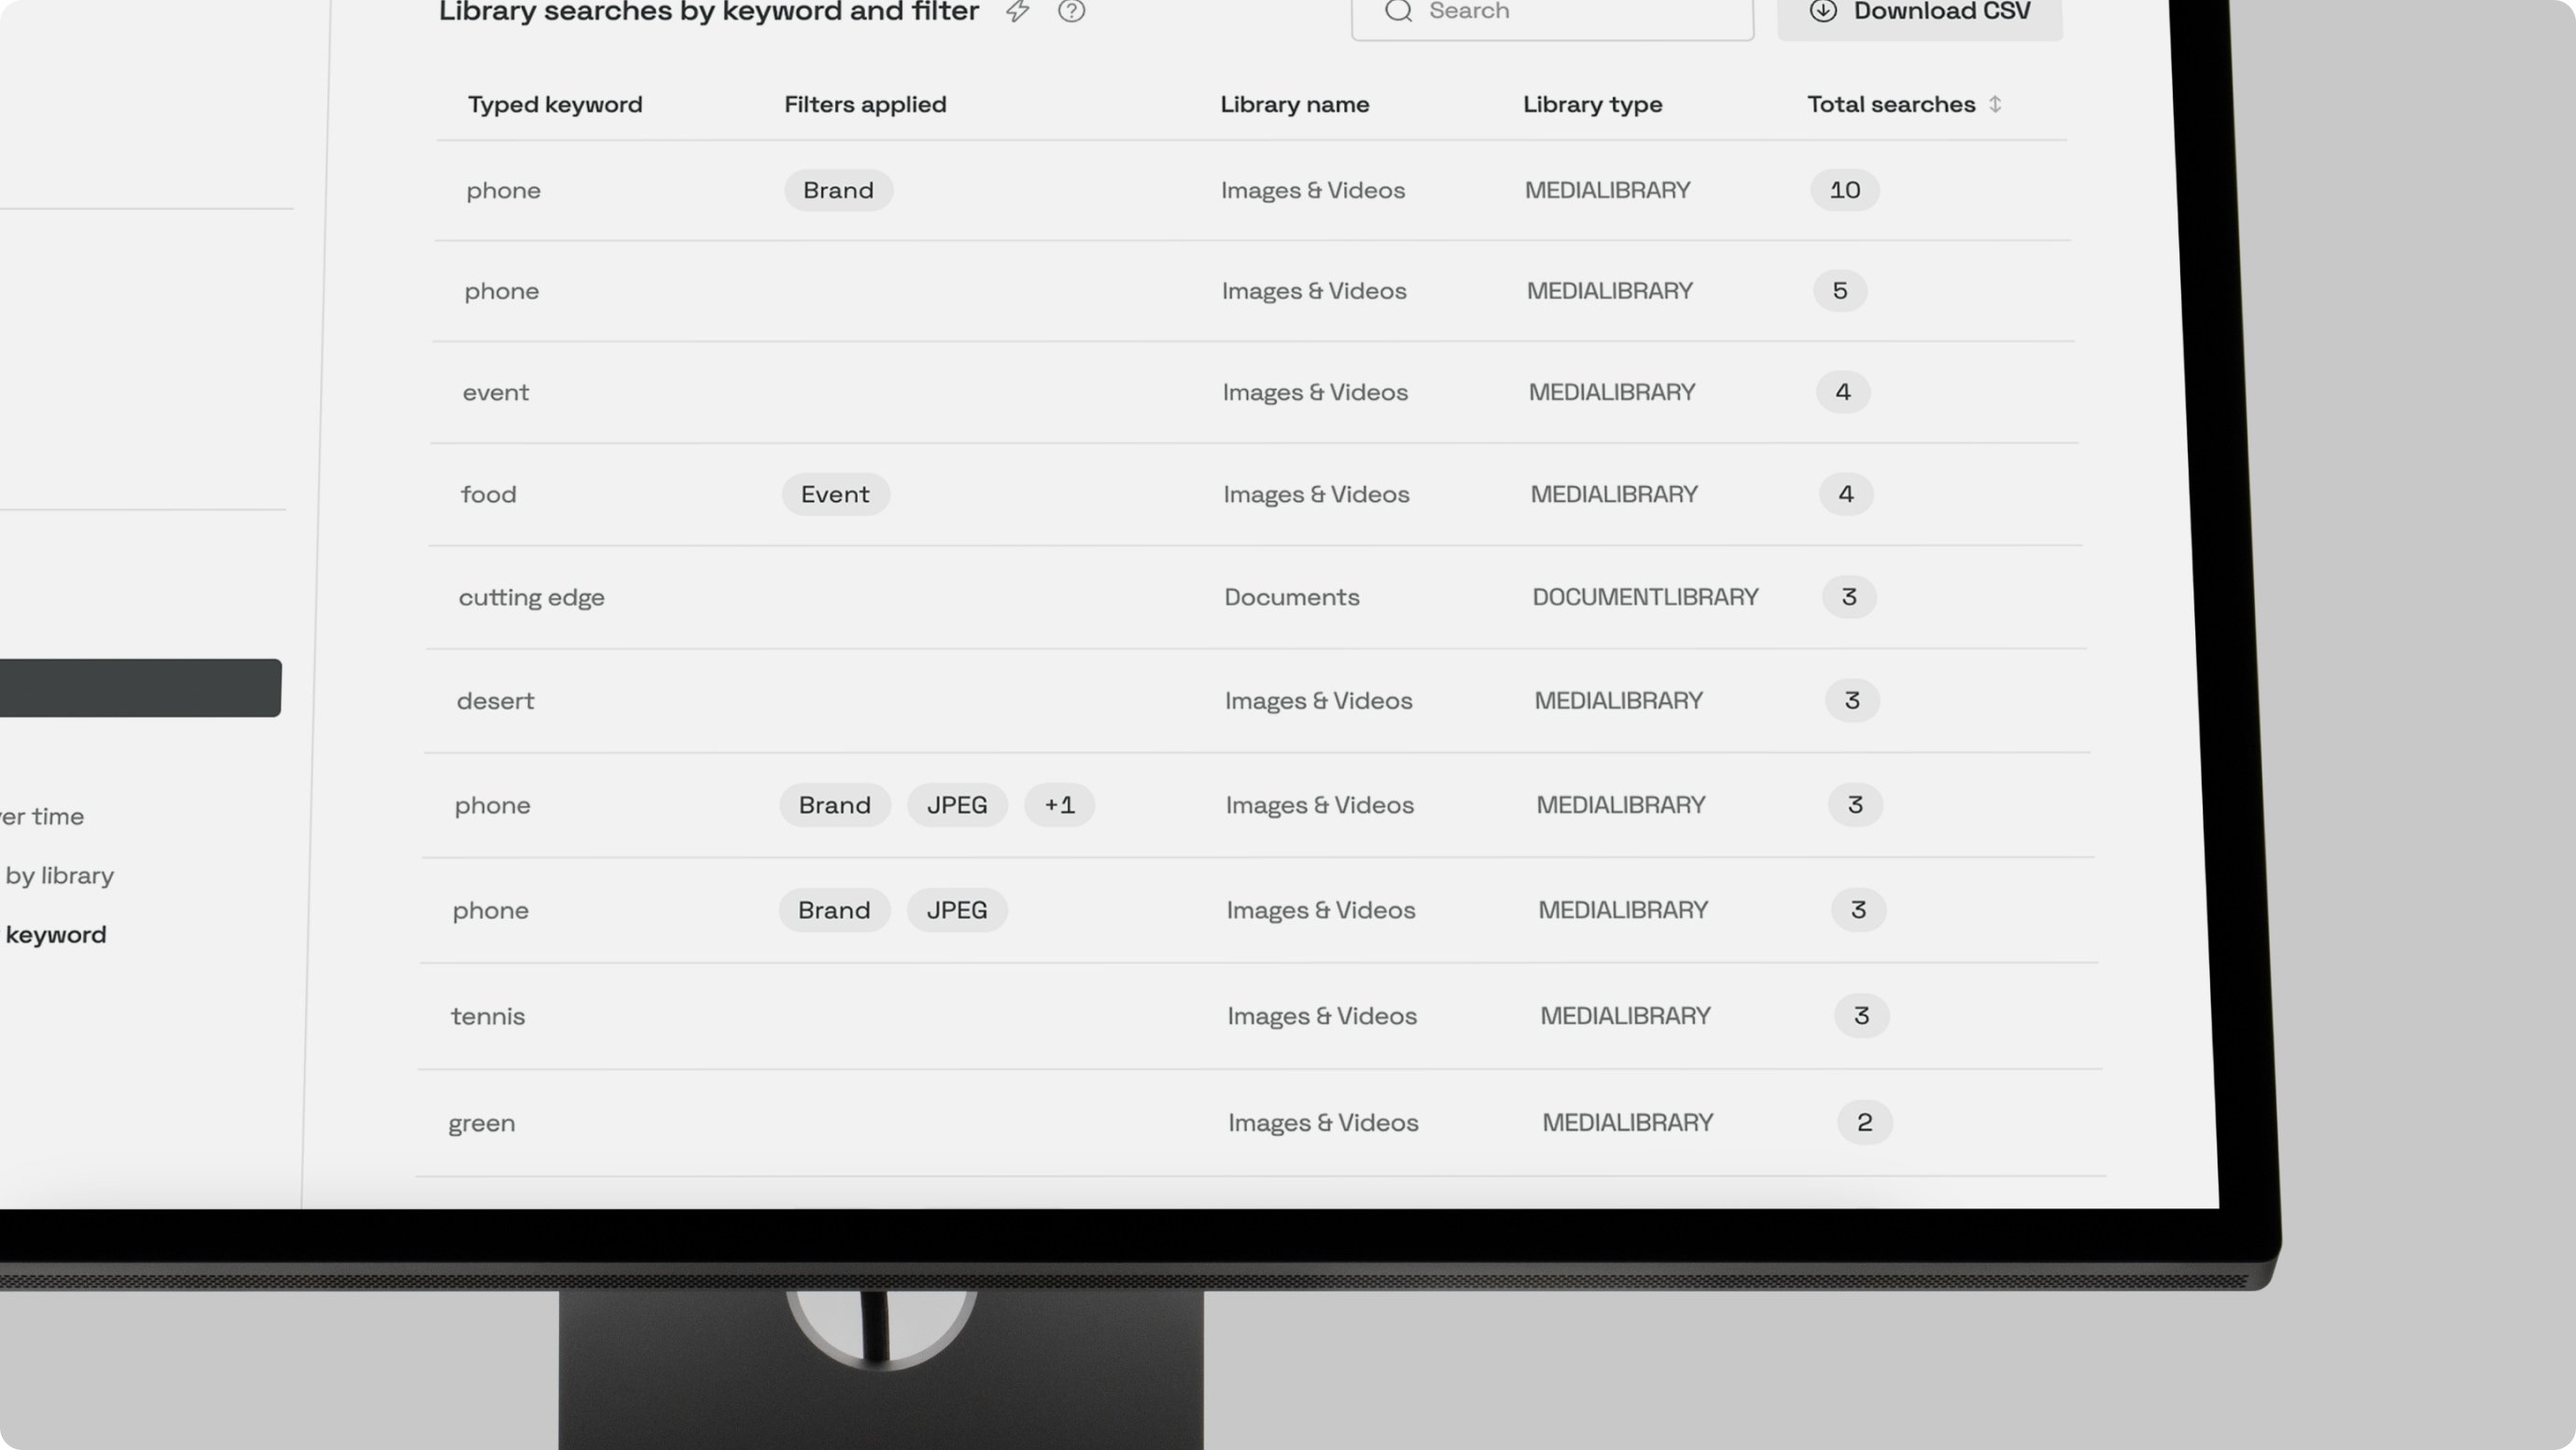
With our newly launched Analytics Dashboard, you can dig deeper into the gems buried underneath every interaction your users and audience make with your brand. You can now pull the curtain back on what separates the best brand-wide practices from the rest. This knowledge comes from understanding:
- Which are the top performing brands in your portfolio?
- What are the most visited and used guidelines?
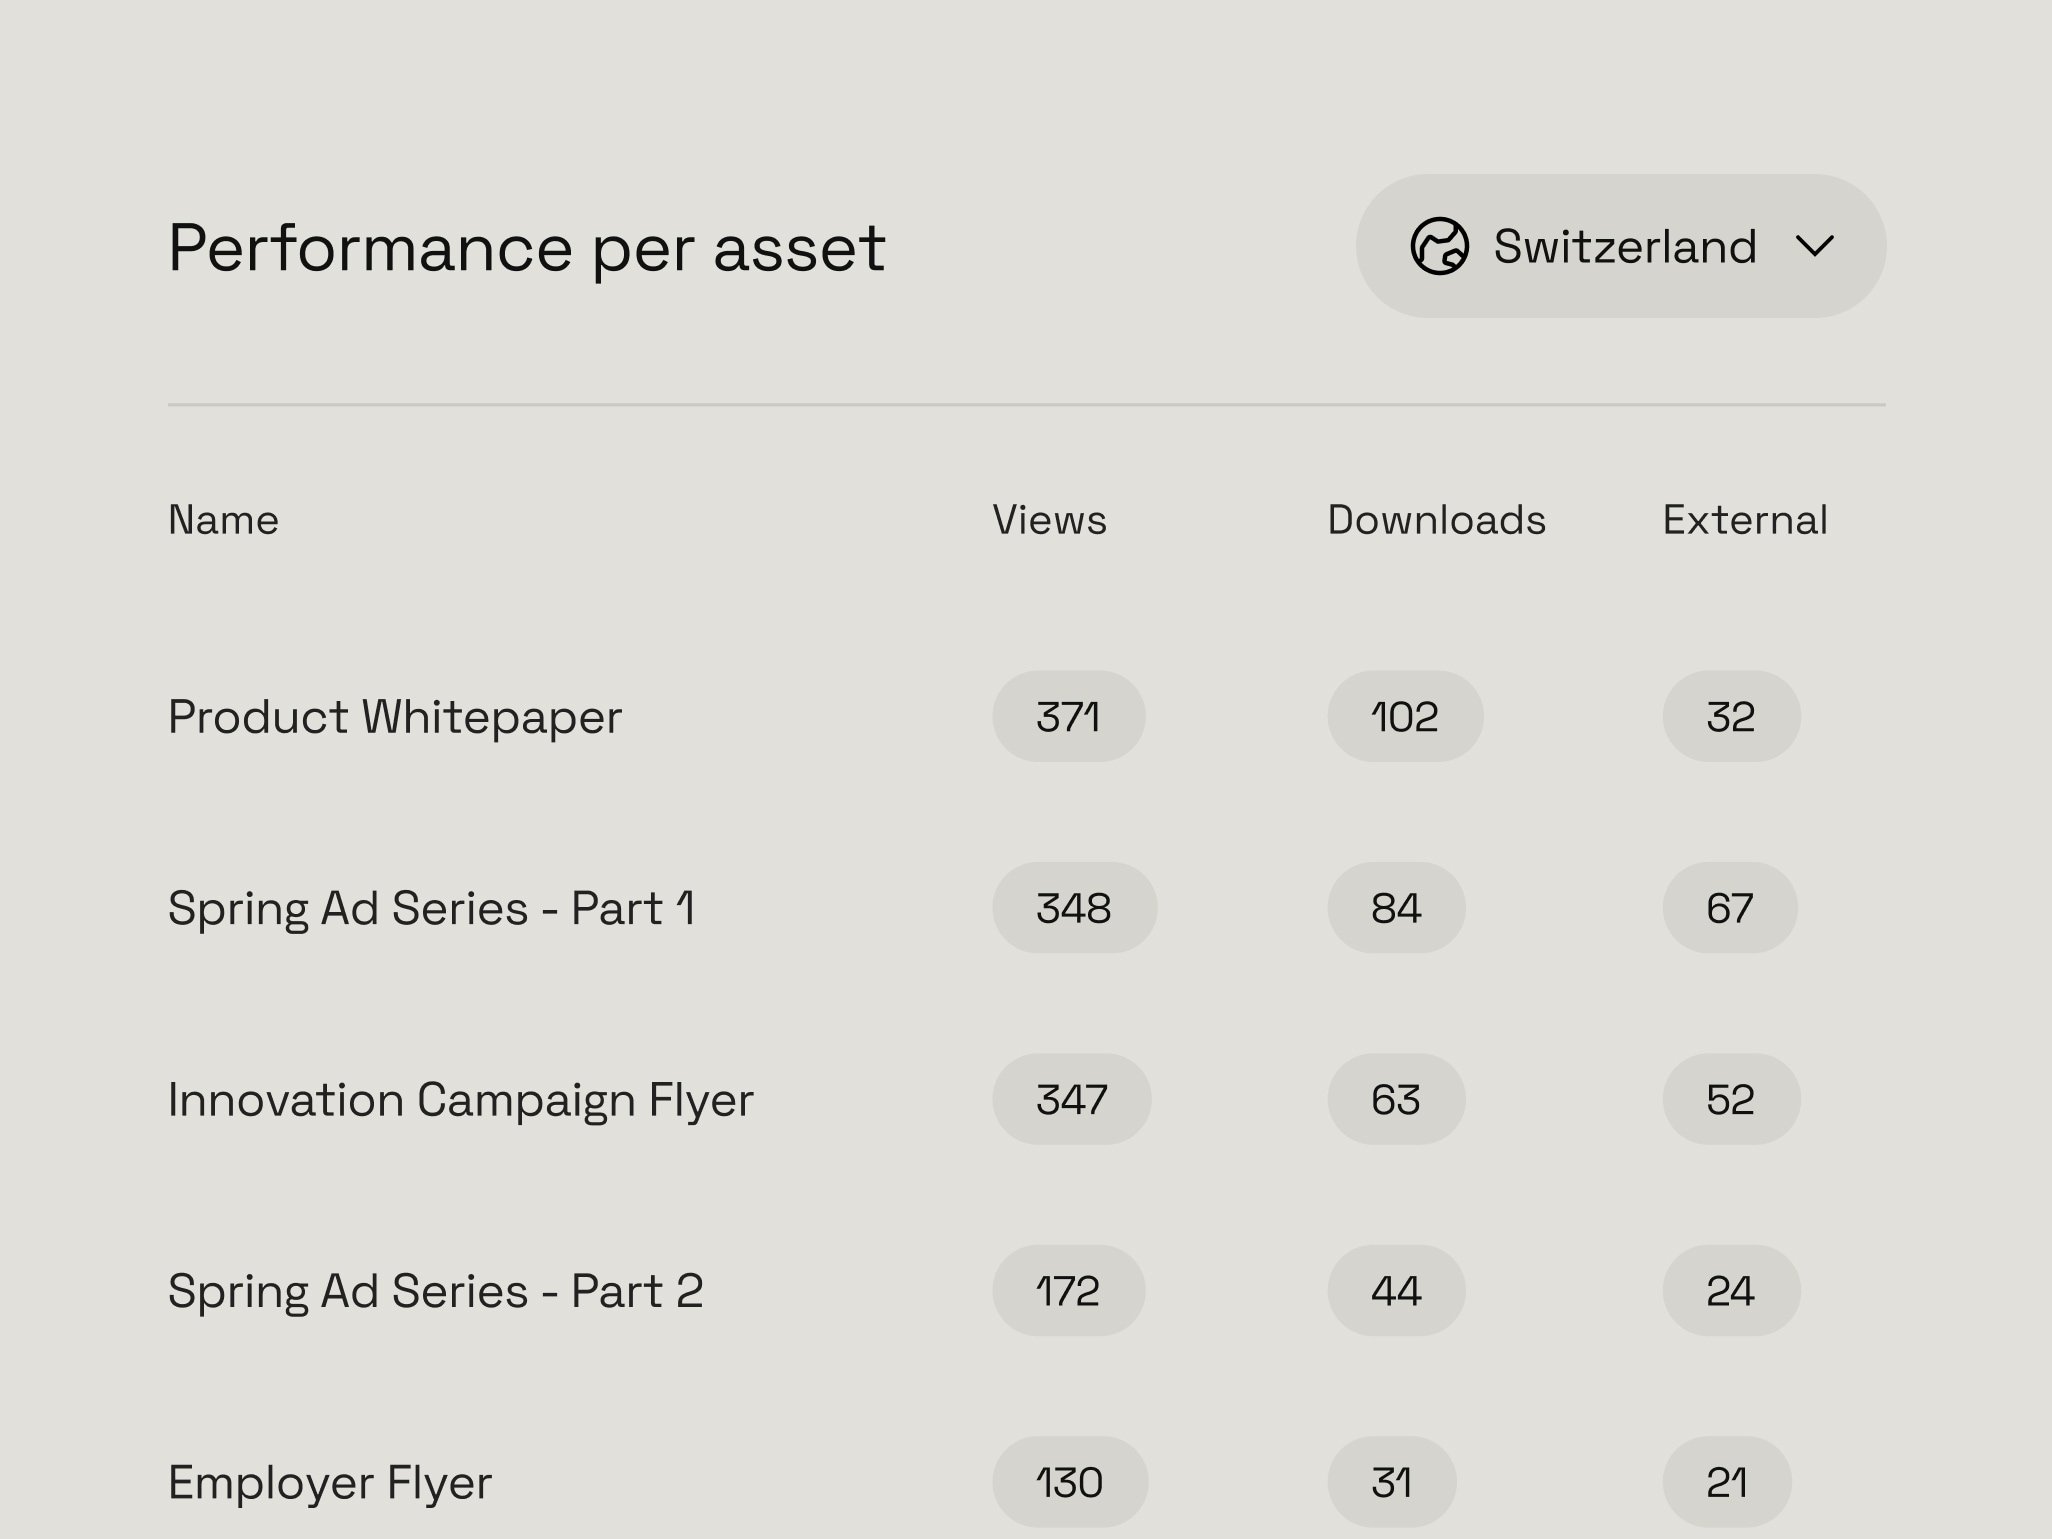
- How many times are assets downloaded, viewed, and repurposed?
- How often are these assets used outside Frontify?
- Which are the top integrations used to access brand assets?
By using the Analytics Dashboard, you will create a data-driven culture that mitigates the risks inherent to creative and brand-level decision making. Brand Analytics can be used to make concrete:
- Budget Decisions
- Content Marketing Decisions
- Software Integration Decisions
Drive Your Budget With Your Brand Top-Of-Mind
Before moving on with any budgeting decision, an assessment has to be made on where your business stands. But, tweaking marketing strategies to optimize budgets becomes a lot about tradeoffs when there’s a lack of tangible data.
By understanding how your brand assets are performing and where they get the highest recognition, you could eliminate much of the guesswork and steer your budget spending to achieve the highest ROI.
Strategize With Brand-Shaping Content Marketing
You likely don’t have a shortage of content that’s shared and used throughout your organization. But creating content without analytics is like running with your eyes closed. And that’s a huge bet. You are moving forward, but most probably, not in the direction you want. With data on views, downloads, embeds and more, you can understand which content really shines and what your audience actually cares about.
As a creator, you no longer have to patch data from different dashboards, like Google Analytics, Contentful, or Hubspot to analyze which content resonates well with your audience. All the data you need to clone best performing assets, or identify outliers is accessible to you within a single view in the Analytics Dashboard.
Integrate Software That Smooths Out Brand Operations
As a brand leader, you are always working on refining your brand operations to make staying on-brand as smooth as possible. It sometimes feels like a complicated puzzle with many pieces that you have to put in the right place. The Analytics Dashboard will give you a bird’s eye view of your brand operations – helping you identify the missing pieces in your users’ daily workflows. Data will allow you to pinpoint the exact integration you need to fill in these operational gaps. If you notice that your Sales team is regularly sharing whitepapers in their Hubspot communications with customers, then that’s a need for an integration that you can’t ignore.
In addition to implementing smooth brand-wide operations, Analytics Dashboard will help you optimize your existing integrations and the costs they incur on you. Based on usage data, you can see which integrations are heavily used and which aren’t. So, you could decide on what integrations to keep or even upgrade, and perhaps, which to discontinue.
With the Analytics Dashboard, you create data-driven brand operations, and discover things you probably never knew about the way users interact with your brand. But more importantly, it would eliminate many decision making bottlenecks.
Try the Analytics Dashboard out when you’re preparing for your next budget meeting, or when you’re lost on which is the next content piece you have to work on. And if you still need more information, dig into the details in this help article, request a demo, or reach out to your Customer Success Manager.